
Natality and birth rate
Contents / Index
Natality (Birth Rate) : The number of live births occurring in a population during a specific period, typically expressed per 1,000 individuals per year. In human populations, this is calculated by dividing the number of live births within a year by the midyear resident population, then multiplying by 1,000]
Natality rate = ∆Nn / ∆t
Original-source note: The preceding human birth-rate description uses births per 1,000 individuals per year, while this original equation is ∆Nn/∆t. Both source formulations are retained without silently equating their denominators.
Where, ΔNn = production of new individuals in population.
and Δt = unit time
The natality rate is always positive or zero, as it represents the occurrence of births and cannot be negative.
Maximum Natality (Absolute, Potential, or Physiological Natality) : It is the theoretical maximum production of new individuals under ideal conditions (i.e., no ecological limiting factors, reproduction being limited only by physiological factors). This is also called Fecundity rate
Ecological or Realised Natality : Also referred to simply as natality, this term describes the actual population increase under existing environmental conditions. Unlike maximum natality, it accounts for all the prevailing ecological factors that can influence reproduction. It is commonly designated as the Fertility rate.
Factors affecting natality
Size of Clutch or Litter : The number of eggs or young ones given in one delivery by the breeding female is called litter.
Length of Breeding Season : If the gestation period or breeding season is short, it will give more births and vice versa
Original-source note: The original groups gestation period and breeding season together here. Their intended distinction requires source review.
Number of Litters per Year : how many young are being born per litter per year by the species.
Original-source note: The heading refers to litters per year, while its original explanation refers to young per litter per year. Both are retained.
Mortality and death rate
Mortality (Death Rate) : Loss of individuals from a population due to death under given environmental conditions is called mortality. For example, if 10 deer die in a forest within a month, this represents the mortality rate of that population during that period. In human populations, mortality rate is typically expressed as the number of deaths per thousand individuals per year.
Minimum Mortality (Specific or Potential Mortality) : The theoretical minimum loss of individuals in a population under ideal or non-limiting conditions.
Ecological or Realised Mortality : The actual loss of individuals in a population under a given environmental condition.
Vital index
Vital Index : The vital index is a measure of population health and growth potential, expressed as the ratio of natality (birth rate) to mortality (death rate), typically multiplied by 100 for easier interpretation.
Vital Index = (Natality / Mortality) × 100
A high vital index indicates a growing population where births significantly outnumber deaths, while a low vital index suggests a declining population where deaths are closer to or exceed births. This index is an important demographic tool for understanding population dynamics and predicting future trends.
Life tables
Life table : A life table is a statistical tool used to combine information on natality (birth rates) and mortality (death rates) across different age groups and sexes within a population. By organizing this data, life tables provide a comprehensive view of the population's demographic structure.
Life tables play a crucial role in predict population trends and assess the impact of environmental or demographic changes.
Life table is a detailed census of a given population. It is sometimes described as biology of a particular population.
Survivorship curves
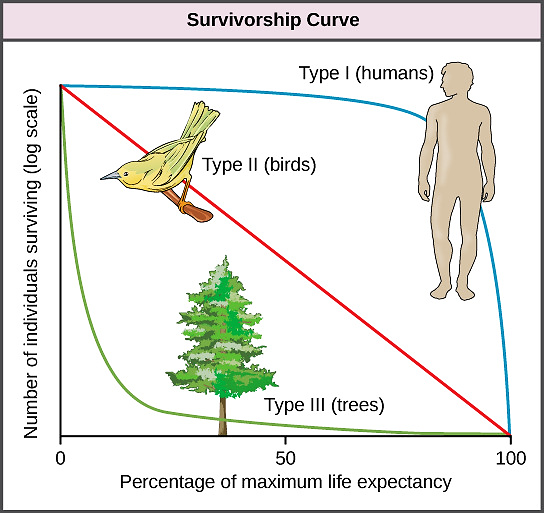
It is a graphical representation that shows the number or proportion of individuals in a population that survive to different ages. The pattern of mortality with age is best illustrated by survivorship curves which plot the numbers surviving to a particular age.
Type I (Highly Convex Curve) : Characteristic of the species in which the population mortality rate is low until near the end of the life span. Thus, such species tend to live throughout their life span, with low mortality. Example – Man, Elephant (large Animals).
Implication : These species often exhibit significant parental care and ensuring the survival of their offspring.
Type II (Diagonal Curve) : This curve represents species with a nearly constant mortality rate across all age groups. The likelihood of dying remains uniform throughout the lifespan. Examples : Rodents, birds, and some reptiles.
Implication : This pattern suggests that these species face consistent survival challenges regardless of age.
Type III (Highly Concave Curve) : For such species in which mortality rate is higher during the young stage.
Examples : Fish, amphibians, insects, and plants that produce large numbers of offspring.
Implication : These species rely on producing numerous offspring with minimal parental investment, compensating for the high early mortality.
Related background
Components of Environment: Biotic & Abiotic
Chapter 5 reading order
- Population Ecology: Density, Dispersion and Age Structure
- Natality, Mortality, Life Tables and Survivorship Curves
- Population Growth: Biotic Potential and Environmental Resistance
- Population Regulation: Density Dependent and Independent Factors
- r and K Selected Species: Traits and Human Impacts
- Carrying Capacity: Types and Forest Management Applications
- Population Dispersal and Fluctuation: Causes and Consequences
- Habitat: Components, Types, Fragmentation and Conservation
- Ecological Niche: Types, Roles and Habitat Forming Species
- Ecophene, Ecotype and Ecospecies: Adaptive Responses